How the Control Center Eliminates Guesswork
Get Instant Answers Without Digging Through Logs
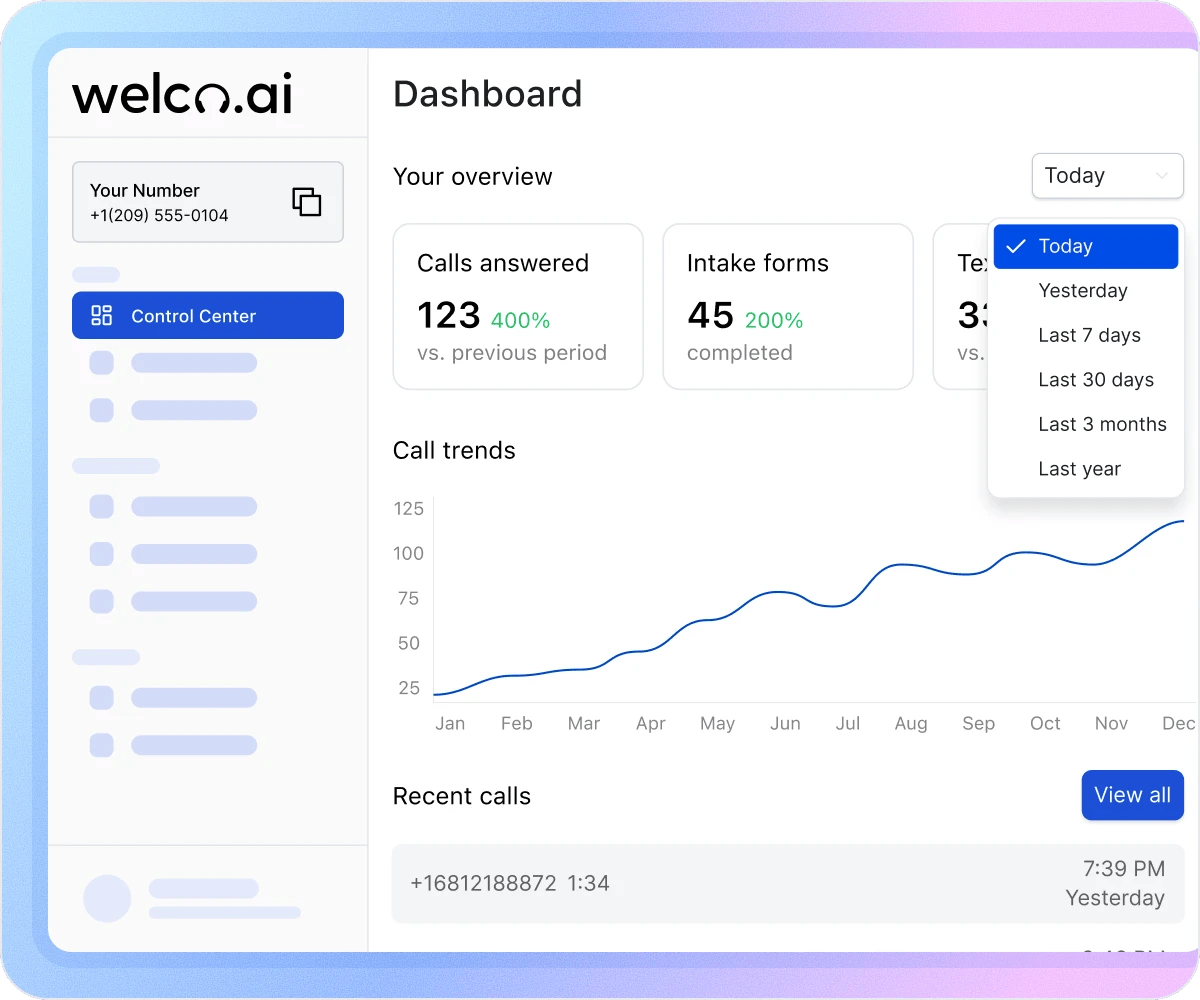
Stop digging through call logs to answer basic questions. Without a dashboard, you ask staff “How many calls did we get?” and get shrugs or guesses. Welco shows exact counts with context: “47 calls answered, up 12% vs. last week.” You know instantly whether it was a slow day or your busiest week of the month. The percentage comparison gives meaning to the number instead of leaving you wondering what’s normal.
Catch Problems Within Days, Not Weeks
Call volume drops for three weeks before you notice. Intake form completions decline but nobody realizes until leads dry up. Without trend visibility, problems hide until they become crises. The Call trends chart makes patterns obvious immediately—rising or falling volume, seasonal changes, and anomalies that deserve investigation all visible at a glance.
See Your Complete Conversion Funnel
Your AI handles 50 calls this week, sends 12 texts, and completes 8 intake forms. Without the dashboard, these metrics live in separate places. Call logs show volume, text history shows messages, intake forms sit in another tab. The Control Center connects them in one view: 50 calls generated 16% intake completion and 24% text follow-up. Now you see the complete conversion funnel and identify where prospects drop off.
What Businesses Say About Welco
“I used to ask my receptionist "how busy were we today?" and get a shrug. Now I open the dashboard and see exactly how many calls came in, how that compares to last week, and which days are trending busiest. I’ve adjusted staffing based on the call trends chart—putting more people on phones during our peak days. Data I never had before is now available in seconds.”

Mike Davis
Owner, Davis Plumbing & Heating
“We track intake form completion rates religiously now. When we launched a new service, we watched the dashboard to see if calls were converting to completed forms. The completion rate dropped, which told us the intake questions needed adjustment. We fixed it within a week because we caught the problem immediately. Without the dashboard, we might not have noticed for a month.”

Rachel Green
Operations Manager Lakeside Physical Therapy
“The percentage comparisons are what I check first every morning. "Calls up 15% versus last week" tells me marketing is working. "Texts sent down 20%" tells me something changed in our SMS workflows. I don’t need detailed reports—just those quick comparisons let me know if we’re on track or need to investigate something.”

John Harris
General Manager Harris Auto Repair
Integrate With 8,000+ Apps via Zapier
Your Control Center reflects activity across all connected features: calls handled, appointments booked, intake forms collected, and SMS messages sent. Connect Welco to your CRM, project management tools, and thousands of other apps through Zapier to automate workflows across your entire tech stack.
Industries That We Serve
Plumbers
Your Jan 23rd spike to 6 calls shows your radio ad worked. Track campaign performance day by day instead of waiting for monthly reviews. The “Last 7 days” filter shows which marketing generates immediate response. Compare week over week to see if momentum continues or fades.
Accountants
March 15th always shows 3x normal volume as tax deadline approaches. Plan coverage two weeks ahead based on previous year’s patterns. The “Last year” comparison shows exactly when to add temporary help. Prepare for the surge instead of scrambling when phones explode.
Locksmiths
80% of your calls come between 6 PM and 2 AM. The Call trends chart shows peak emergency hours clearly. Optimize staffing based on actual demand patterns instead of guessing. Day shift might be wasted cost if volume concentrates after hours.
Community Services
Board meetings require impact data. Export “Last 3 months” showing 847 calls handled and 412 intake forms completed. Percentage growth vs. prior quarter justifies resource requests with concrete evidence. Funders want metrics, not stories. Dashboard delivers both.
Personal Injury Law Firms
Monday mornings show 40% more calls than Fridays. Intake completion rate is 15% higher on weekday mornings vs. afternoons. Schedule your best intake specialist during peak conversion windows. The dashboard reveals patterns that maximize case acquisition.
Financial Advisors
Market volatility days show 2.5x call volume as clients panic or see opportunities. The real-time dashboard alerts you to consultation demand spikes. Extend hours or add staff the same day instead of losing warm prospects to competitors who answer first. Timing matters in financial services.
Know How Your AI Receptionist Performs – Instantly
Stop guessing about call volume, intake completions, and phone system performance. Welco’s Control Center delivers real-time metrics, trend visualization, and period comparisons so you always know exactly what’s happening.
FAQ about Control Centre in Welco
Which Welco plans include the Control Center dashboard?
The Control Center dashboard is included in all plans: Starter ($39/month), Professional ($99/month), Business ($149/month), and Enterprise. Every Welco user gets access to overview metrics, call trends, and recent calls regardless of plan level. All features shown in the dashboard are available to every subscriber.